NEWS: CrowdScan measures occupancy in The Beacon innovation hub
Since this spring, counting has been in full swing at the Antwerp innovation hub, The Beacon.
CrowdScan, which also has its office in the building, measures in real-time the exact number of people present in the public areas of the office building.
With the energy crisis and climate change in mind, it is crucial to use energy sources smartly and efficiently. Adjusting the HVAC system or lighting based on the measured occupancy is one of the many actions that smart building management can take to optimize energy consumption. In addition to more efficient energy use, occupancy data can also contribute to better utilization of spaces.
The Beacon management is also embracing this idea and has provided the office building on Sint-Pietersvliet as a living lab for CrowdScan.
Robin Pauwels, Community Manager of The Beacon: "We want to transform The Beacon into a smart workspace. Thanks to the CrowdScan data, we gain even more insights into how the building is being used. How can we arrange our floors to make residents feel more at home? Which events are popular? At what times do event visitors stay longer for networking? This analysis offers invaluable insights that can significantly impact our policymaking process.”
Easy and privacy-friendly
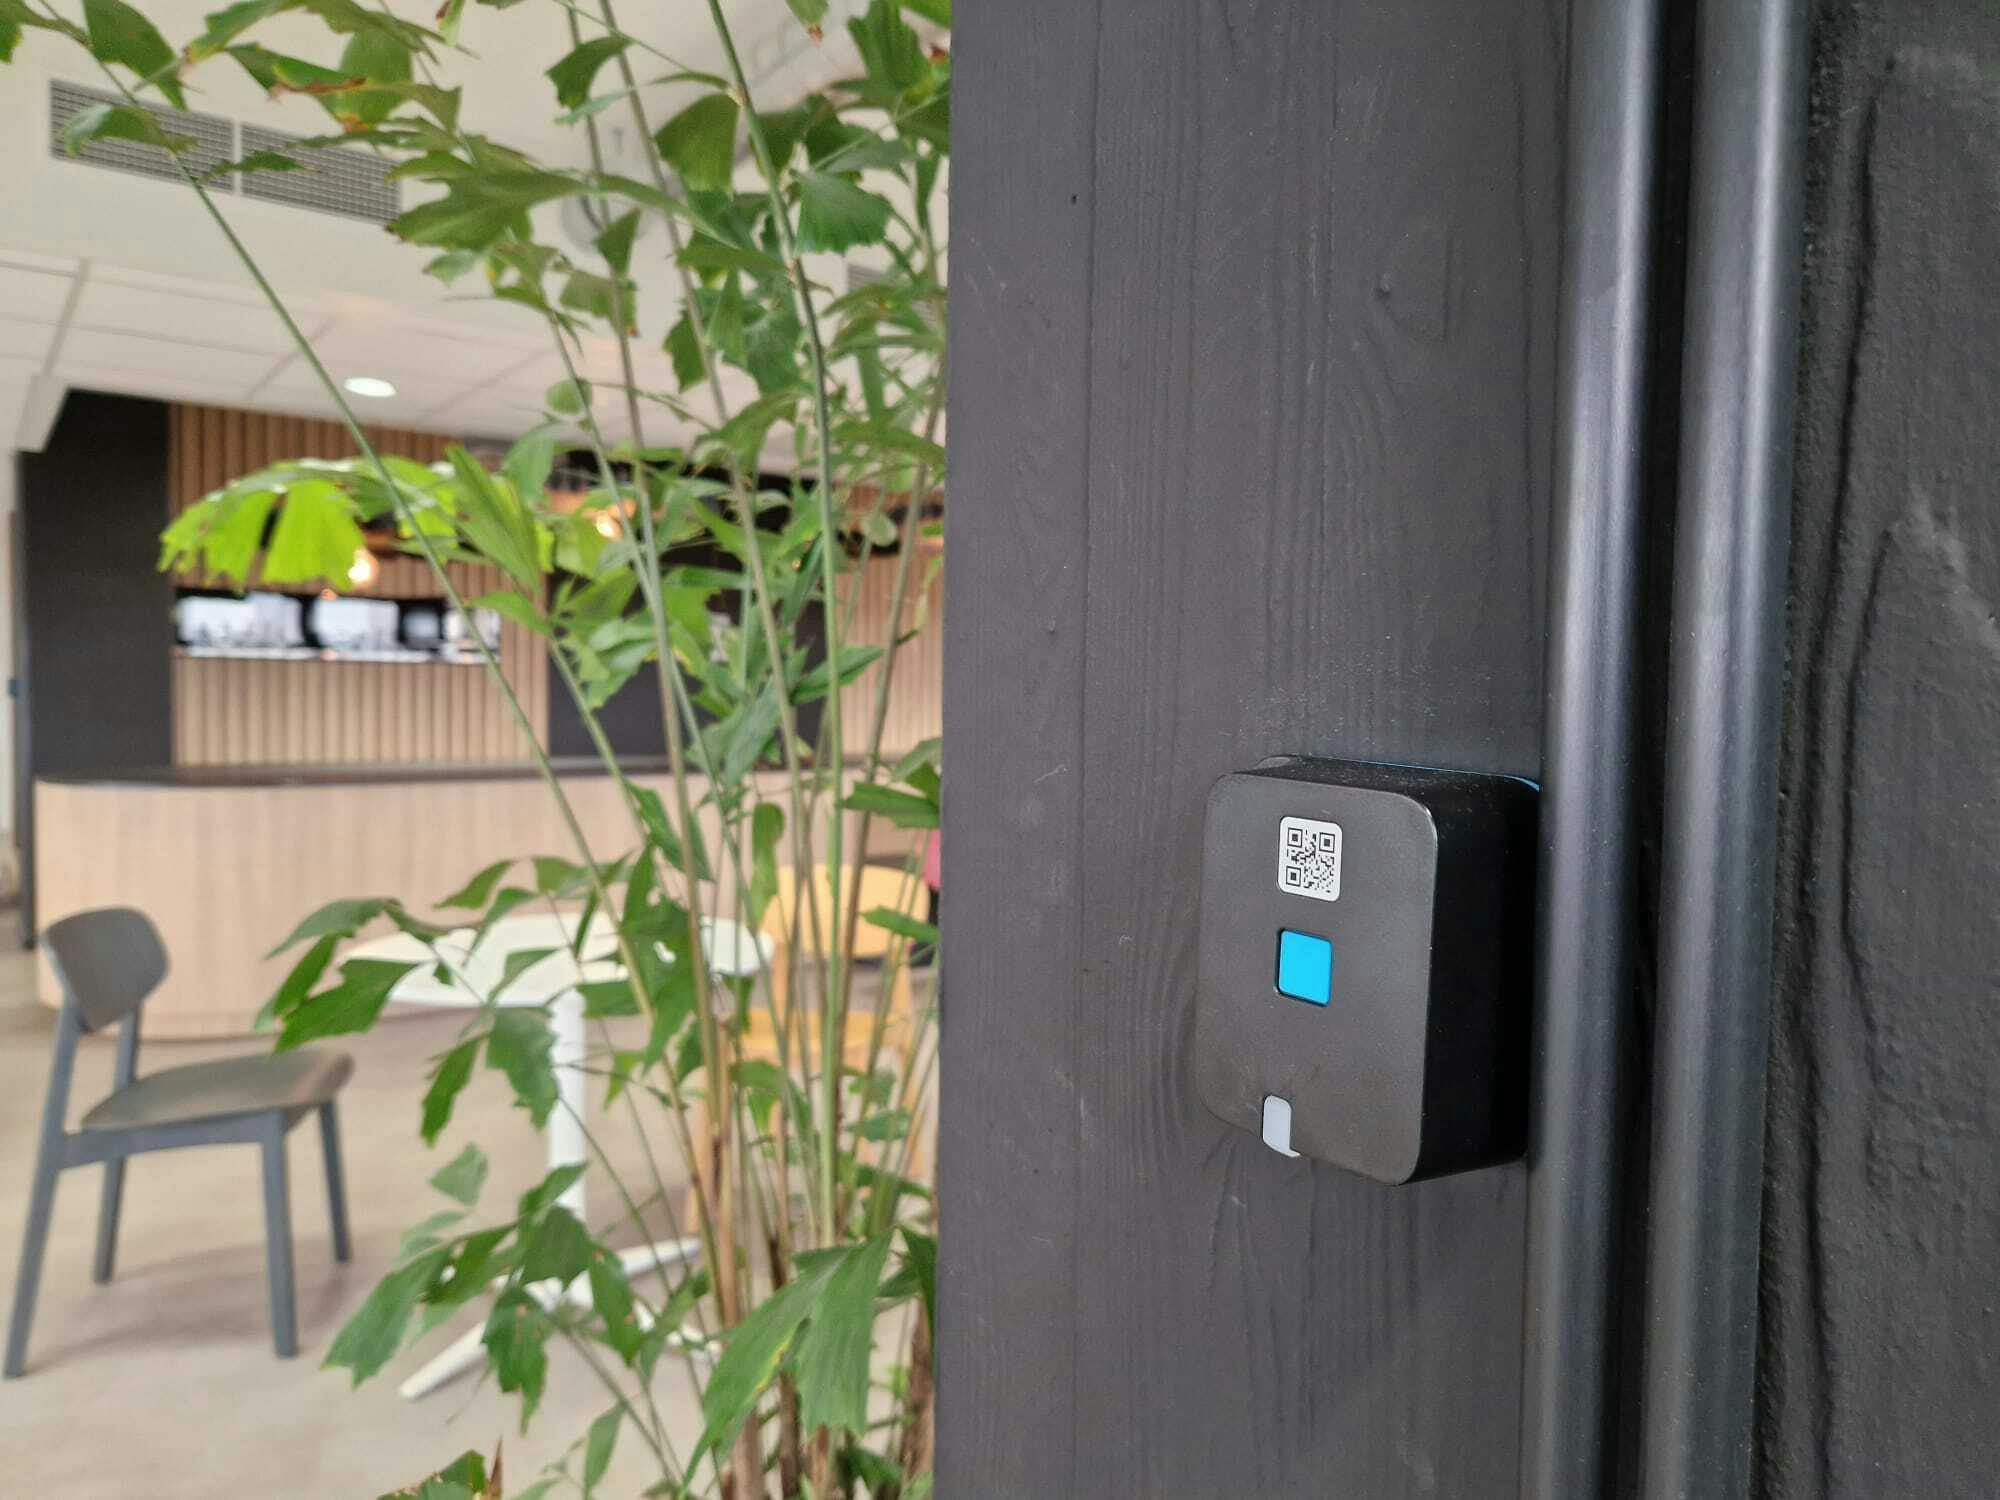
The visual dashboards of CrowdScan show the exact number of people present in public areas, such as the cafeteria or terrace. The measurement is done through sensors that emit radio signals. By analyzing the signal attenuation, CrowdScan can determine the exact number of people present in an area. The entrances and exits of the building are also monitored using a radar device.
“An increasing number of designers and building operators are seeking our services, recognizing the value of measurement as a source of knowledge”, says CrowdScan CEO Ben Bellekens. "Smart cities are also discovering the value of occupancy data. It can help reduce costs and enhance safety. Imagine streetlights and information boards that are dynamically adjusted in real-time according to occupancy levels.”
After measurement, CrowdScan can provide analysis and recommendations. Since the data is obtained in a 100% privacy-friendly way, customers can retain it indefinitely and combine it with other data sources.
“In addition to the privacy-friendly aspect, another advantage is that the sensors are battery-powered, making them easy to install. This also makes them ideal for temporary settings.”
The following graphs provide insights into an evening when a farewell drink took place.
Graphs
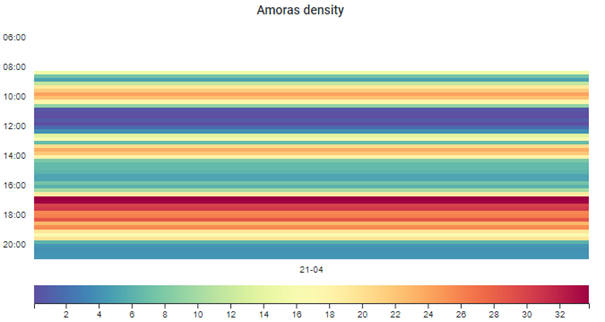
The heatmap of the area
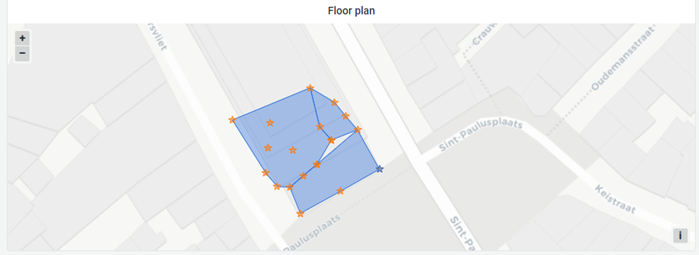
The zone on the eighth floor and the distribution of sensors across the space
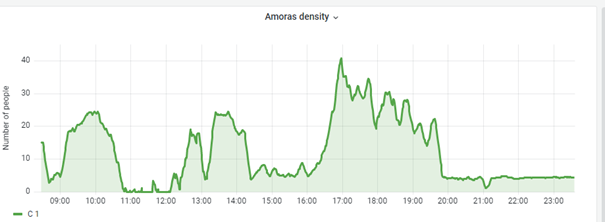
Number of attendees/time
Between 5 PM and 6 PM is the busiest time. This is also the moment when the farewell drink takes place. At the peak moment, there are over 40 attendees.
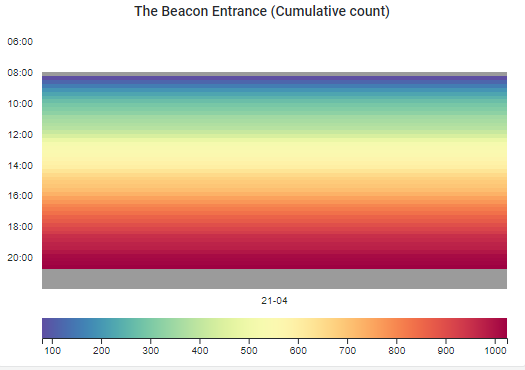
Cumulative number of passages at the entrances and exits
The graph shows that there were over 1000 passages (in and out) that day.
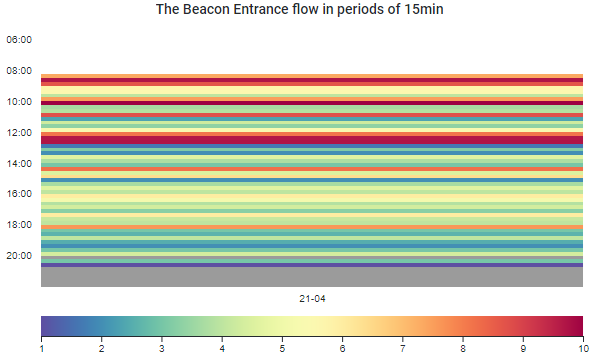
The occupancy at the entrances and exits according to time
In the morning, shortly after 8 AM, most people enter, as well as during lunchtime. Graph 5 shows a high density in the evening, especially between 4:30 PM and 5:30 PM.
This is not observed in Graph 4. From this, we can conclude that the farewell drink was attended by guests who were already present in the building (not external attendees).
The occupancy on the eighth floor according to the time when the farewell drink took place
In the morning, there is a steady increase in occupancy, reaching a peak in the afternoon. Graph 5 shows a significant increase in density in the evening, particularly between 4:30 PM and 5:30 PM. This corresponds to the time of the farewell drink.